Market Performance
Spreadgravity Hyper International Market Performance
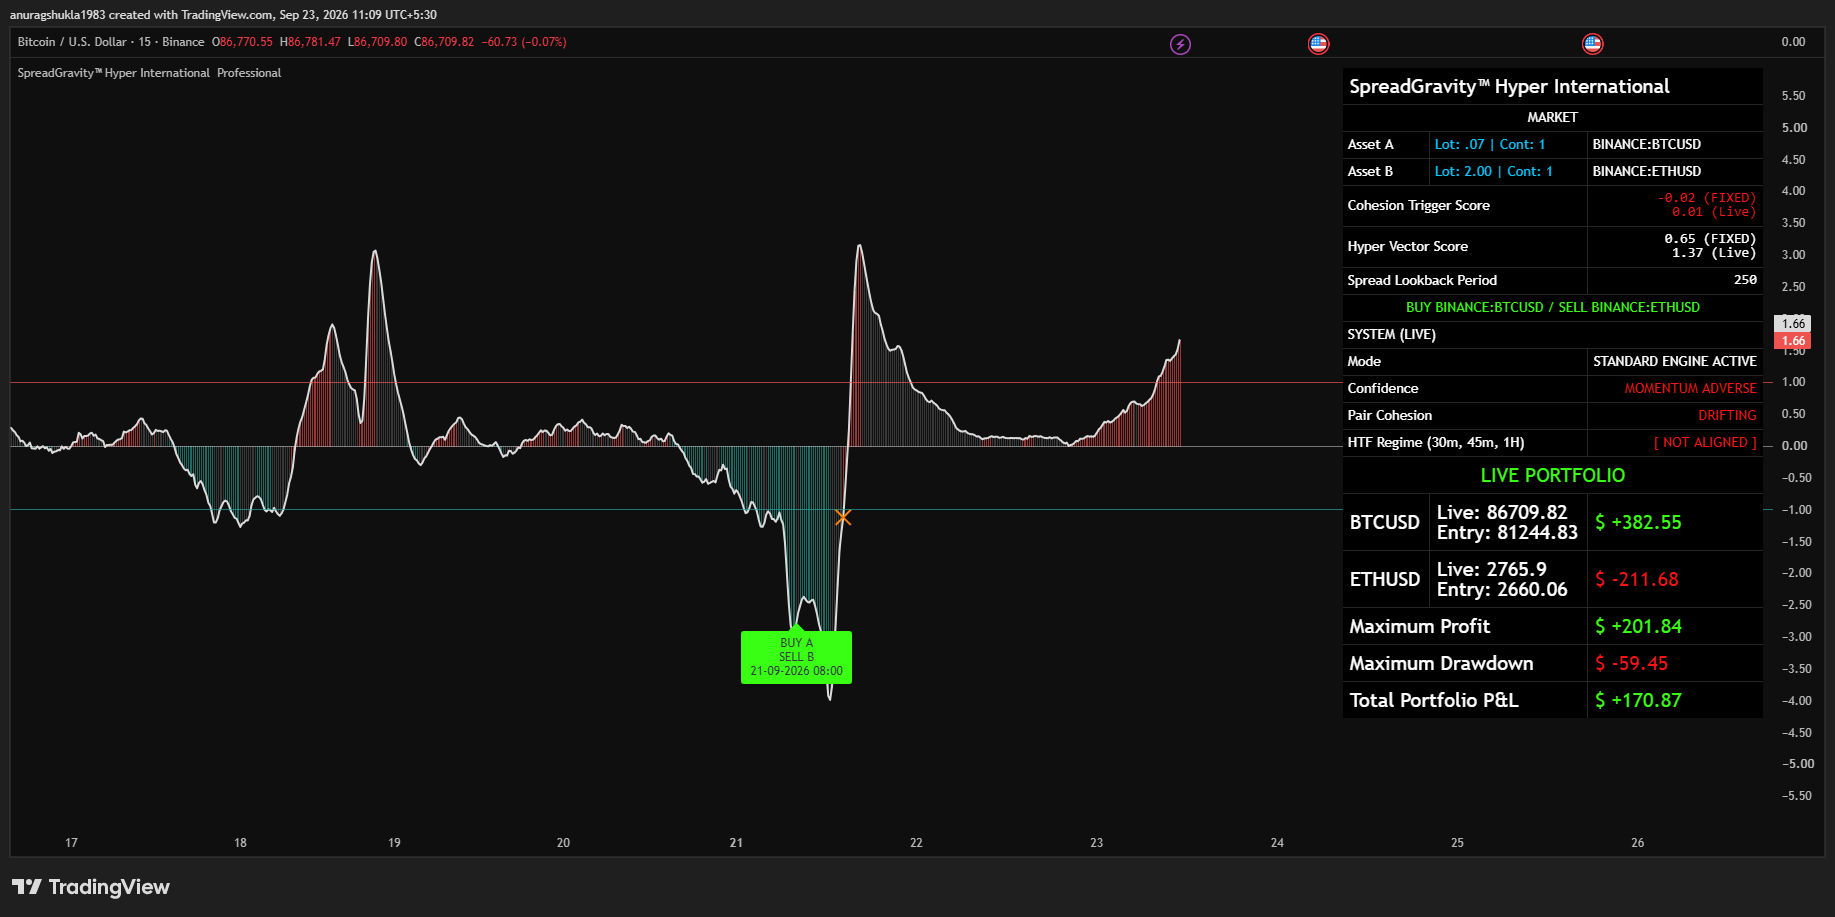
Maximum Profit$ +201.84
Maximum Drawdown$ -59.45
Total Portfolio P&L$ +170.87
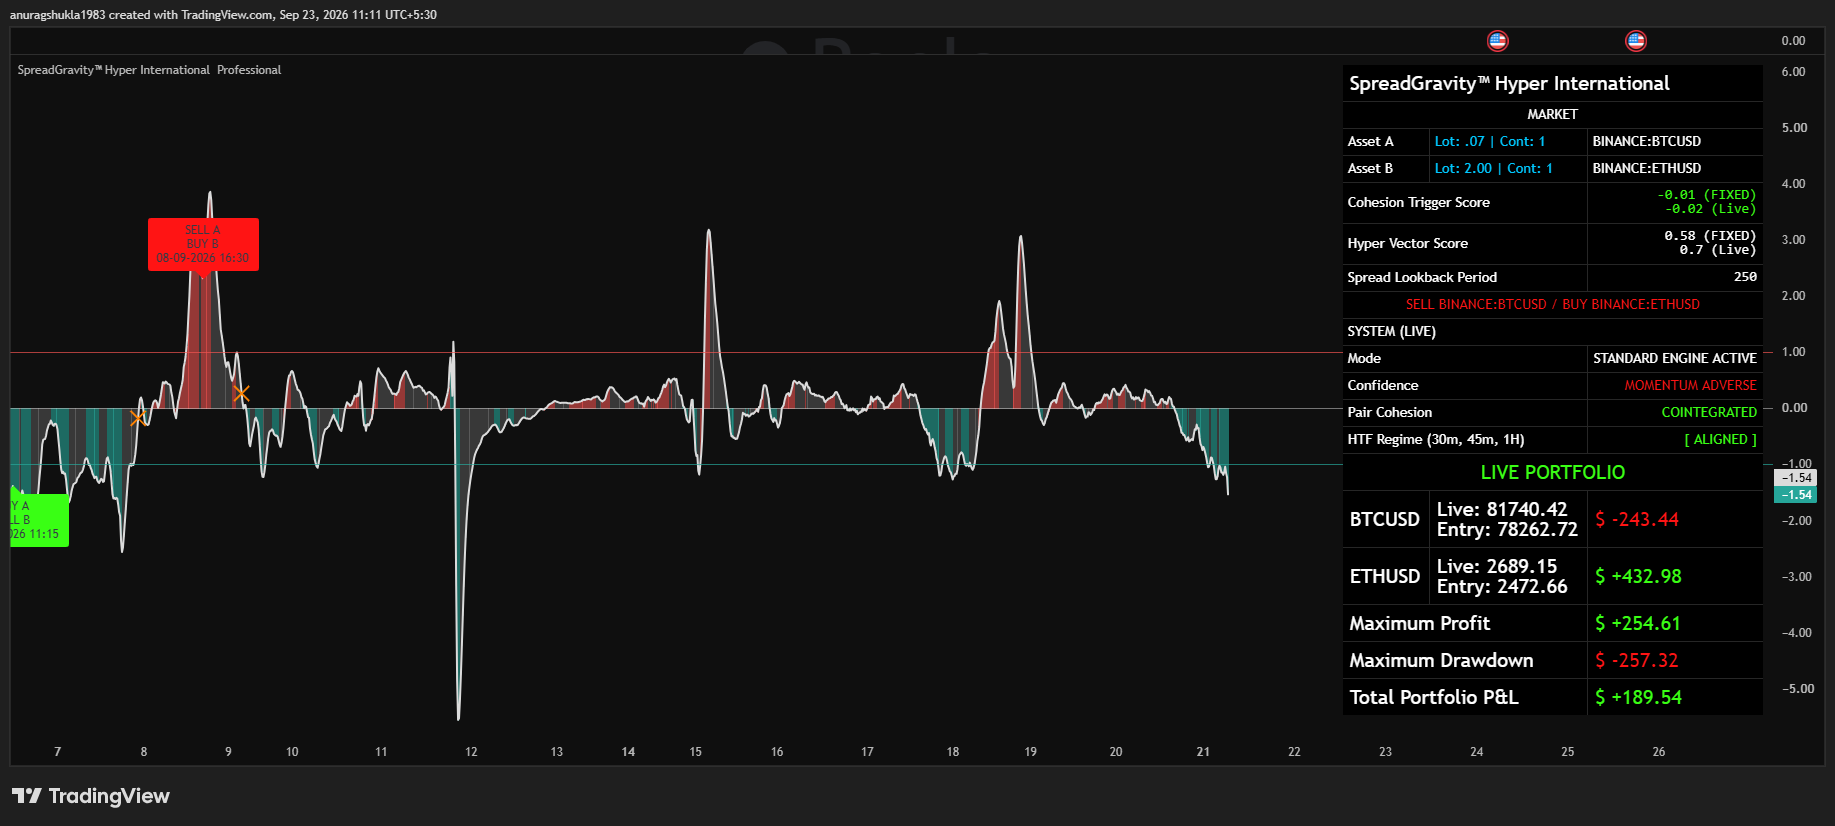
Maximum Profit$ +254.61
Maximum Drawdown$ -257.32
Total Portfolio P&L$ +189.54
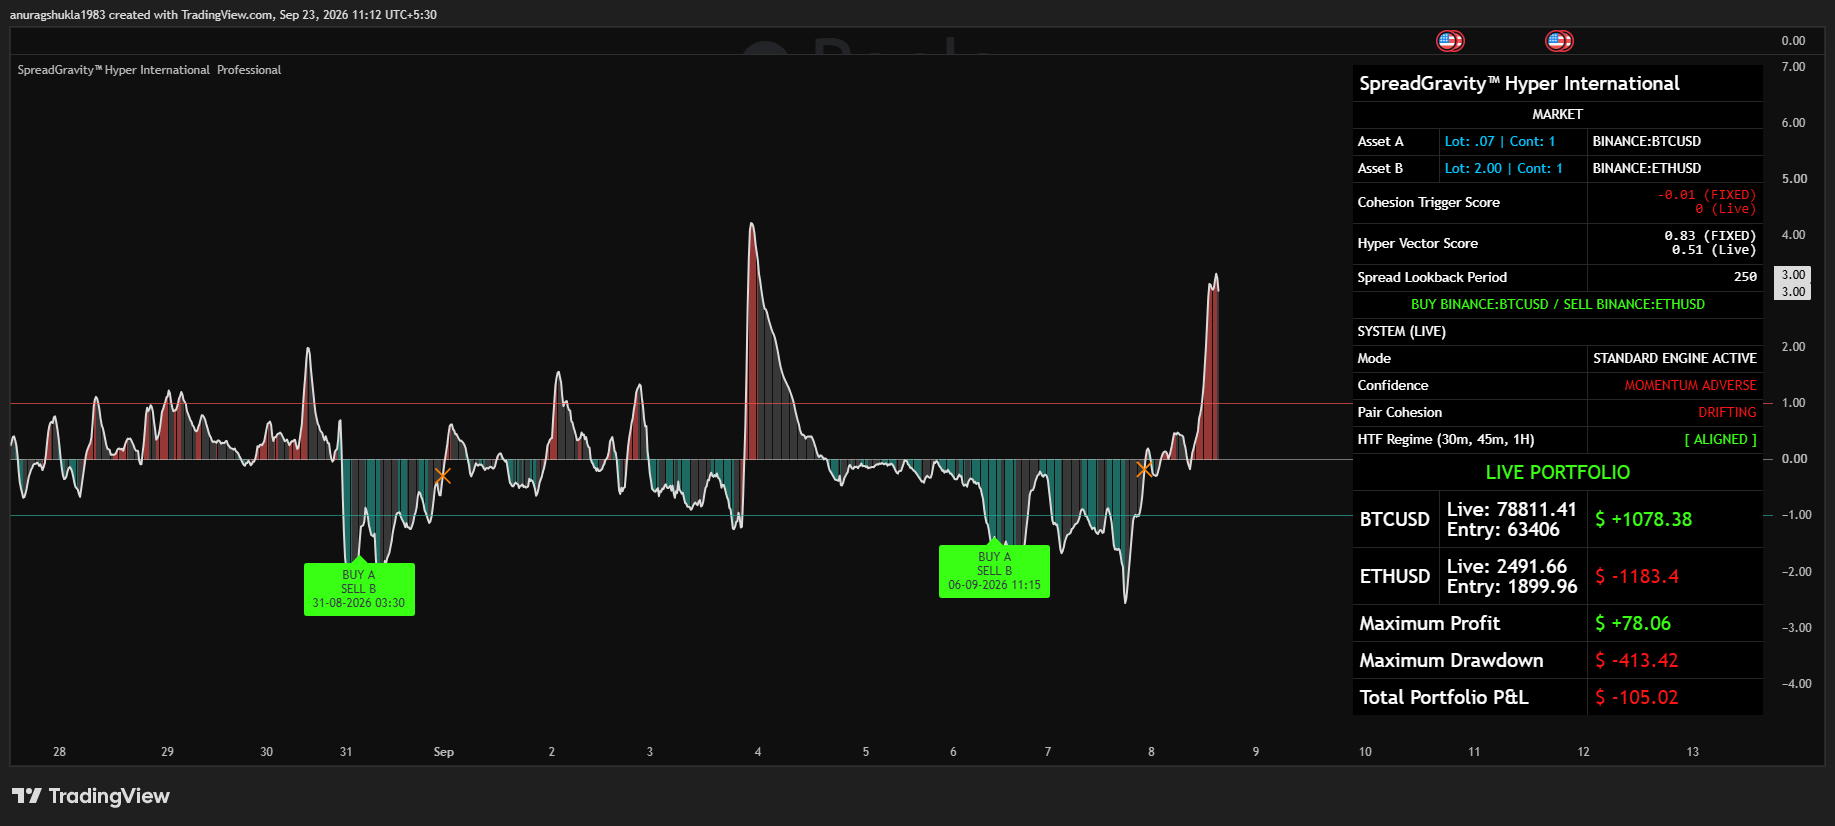
Maximum Profit$ +78.06
Maximum Drawdown$ -413.42
Total Portfolio P&L$ -105.02
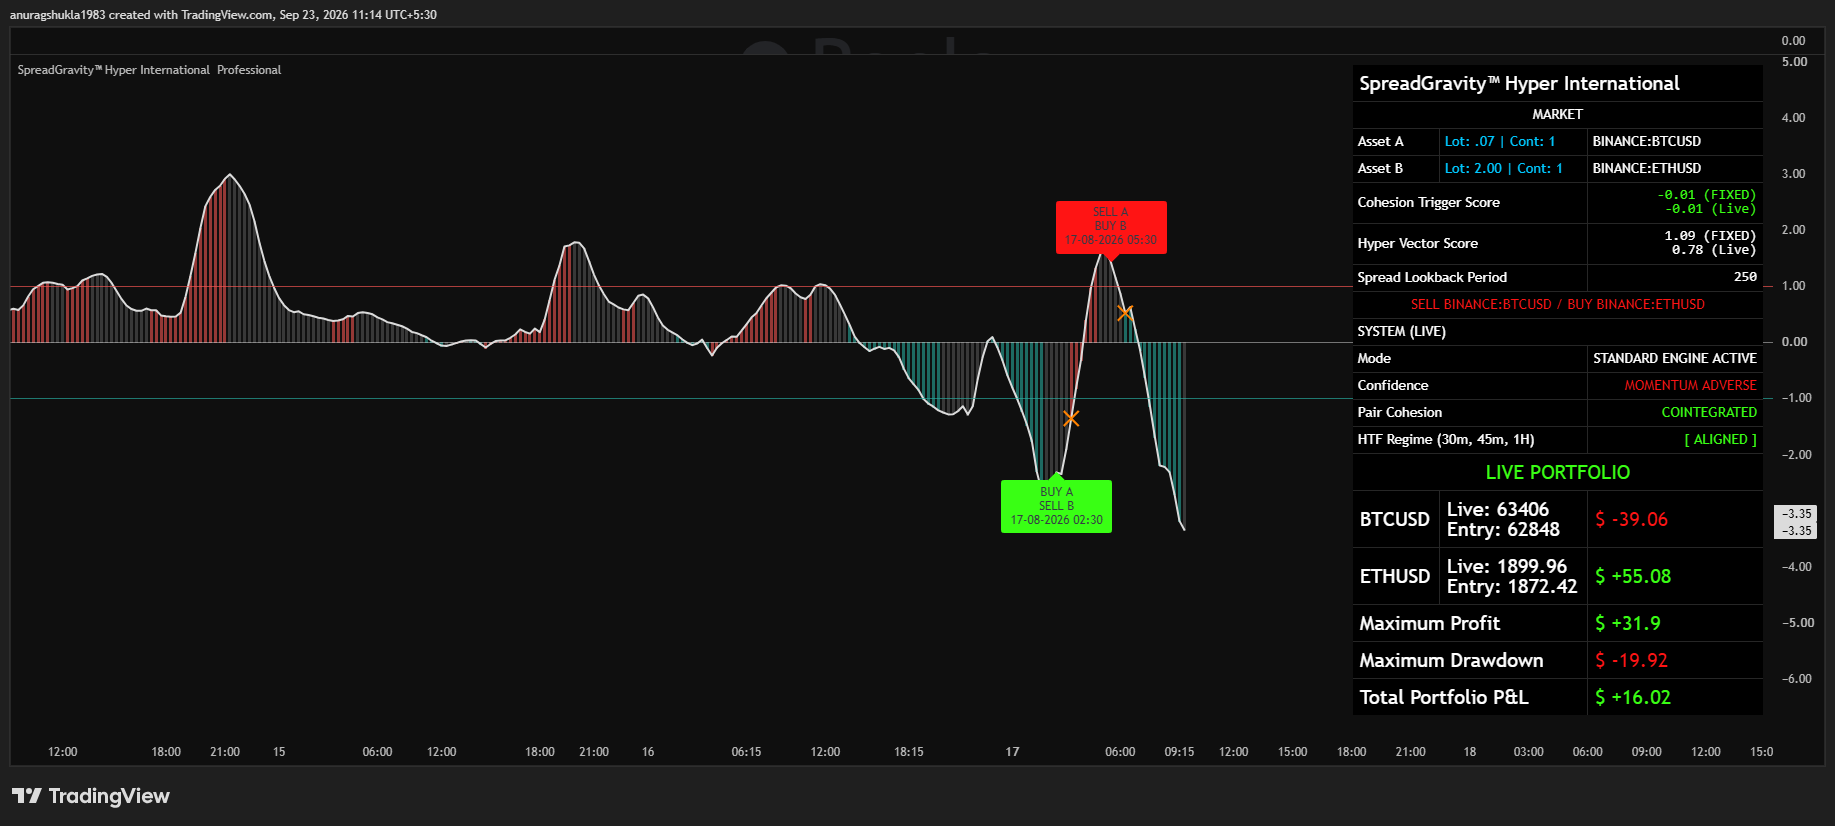
Maximum Profit$ +31.90
Maximum Drawdown$ -19.92
Total Portfolio P&L$ +16.02
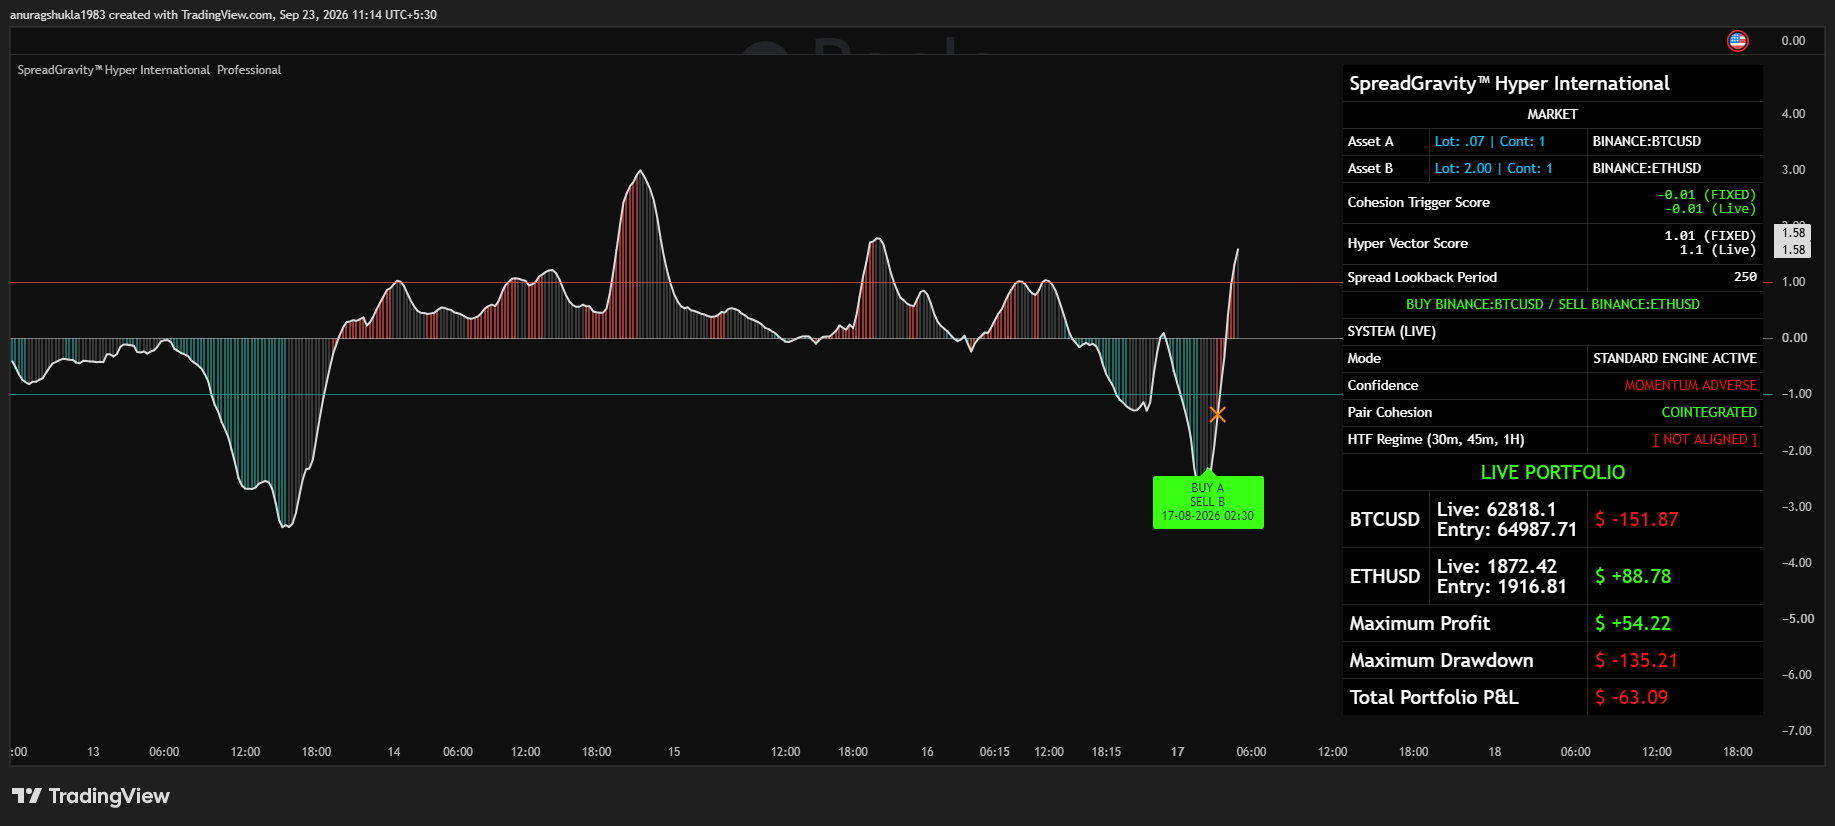
Maximum Profit$ +54.22
Maximum Drawdown$ -135.21
Total Portfolio P&L$ -63.09
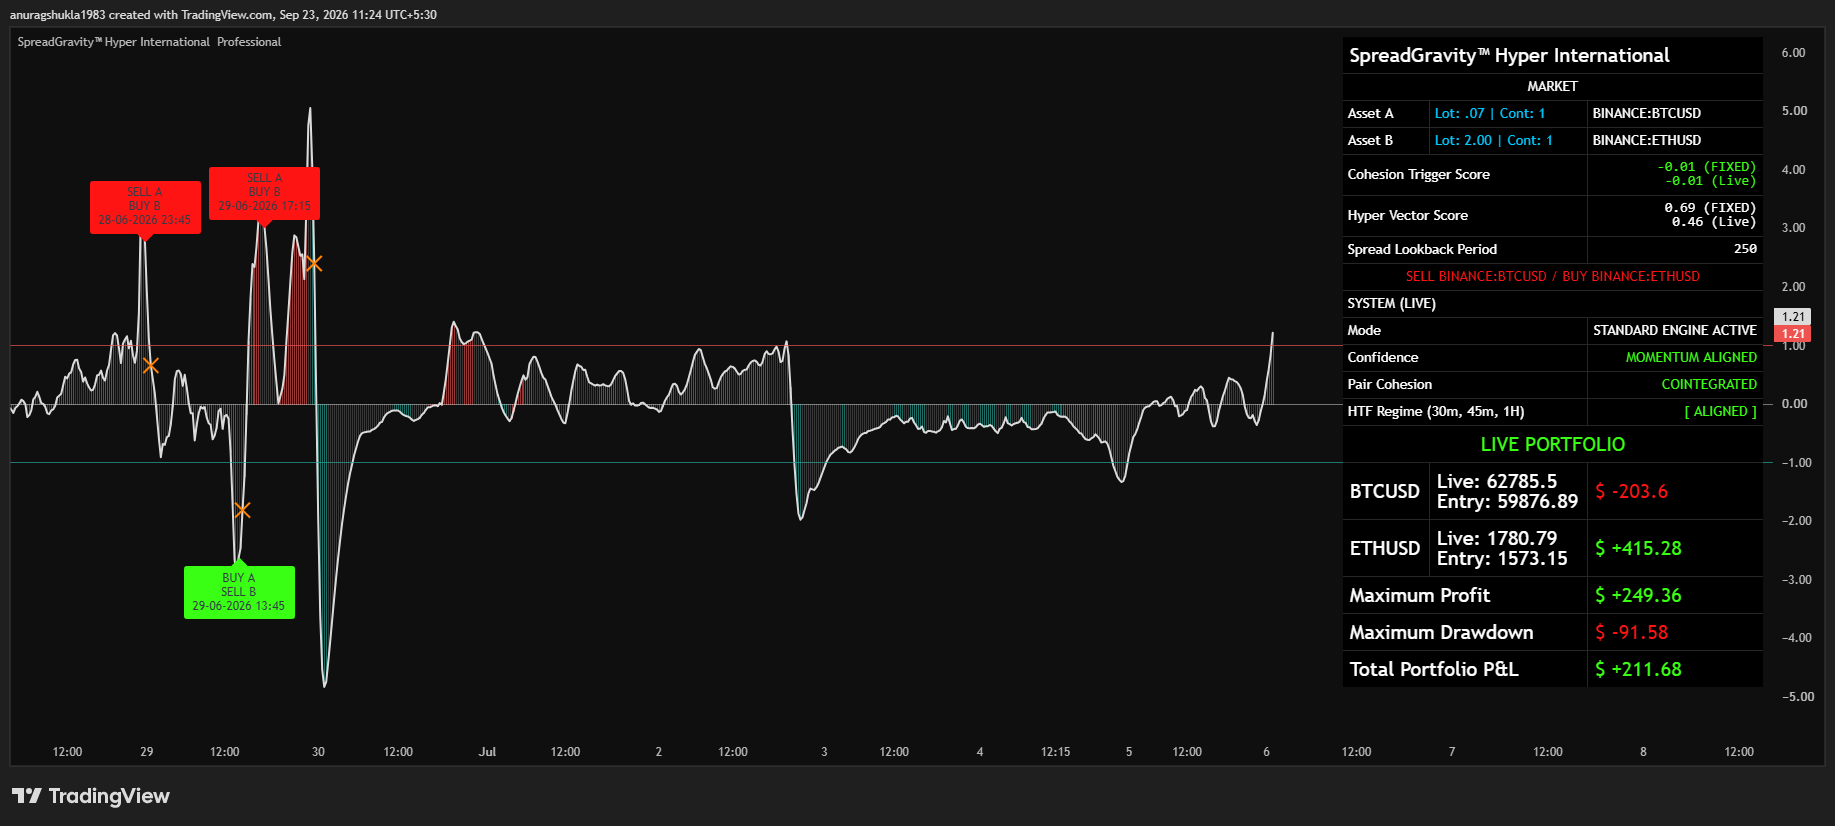
Maximum Profit$ +249.36
Maximum Drawdown$ -91.58
Total Portfolio P&L$ +211.68
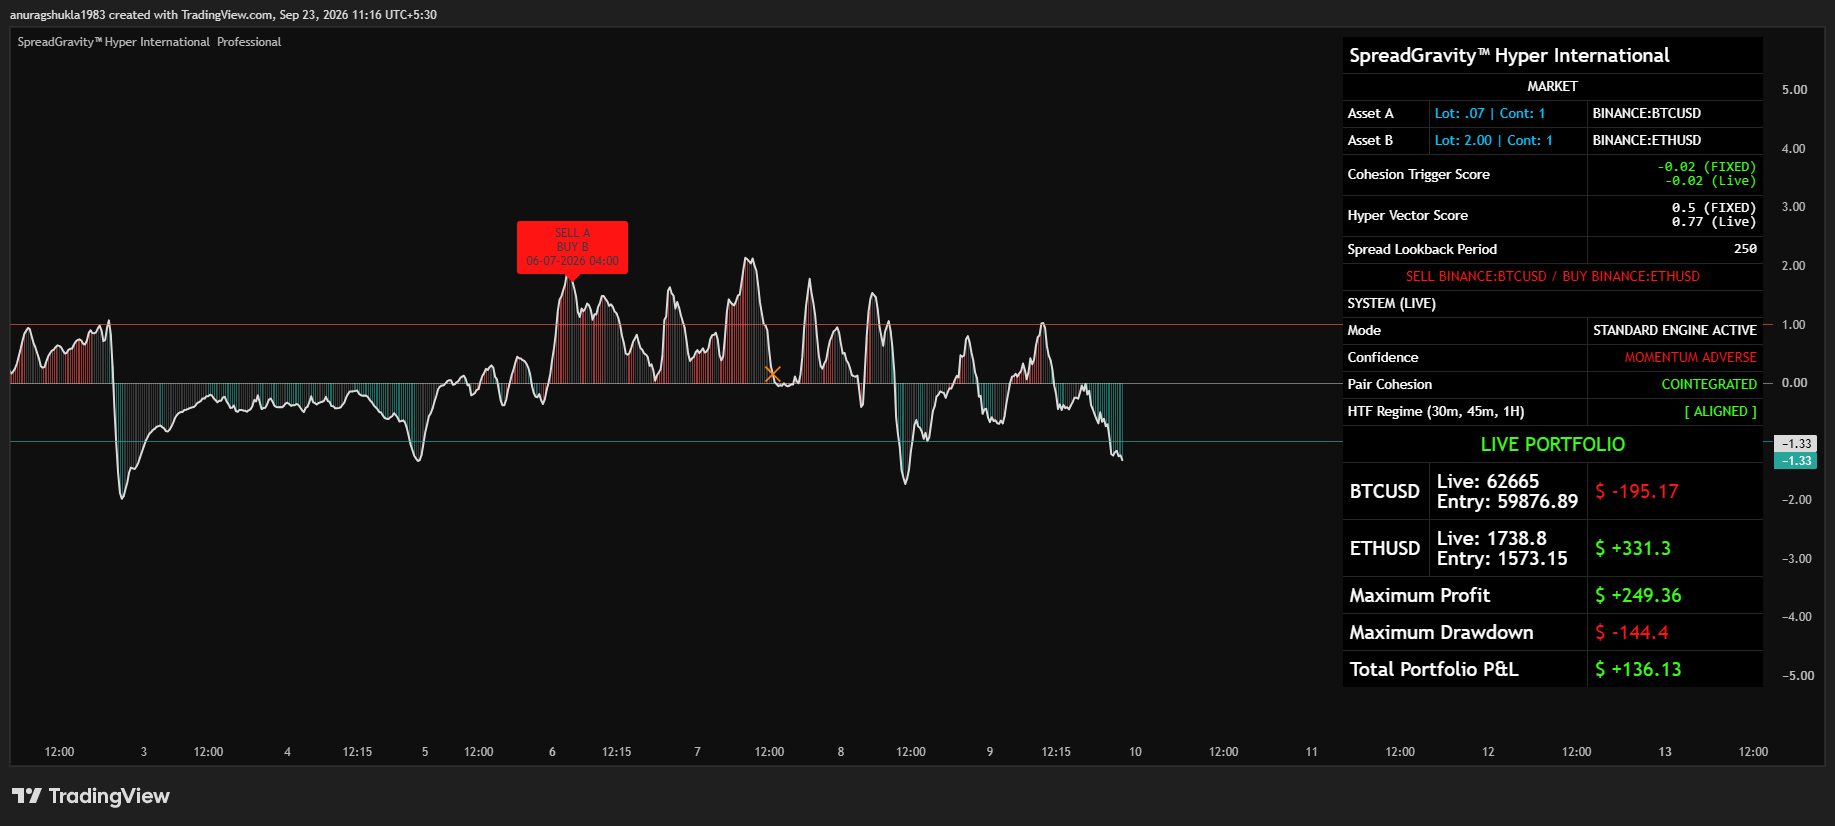
Maximum Profit$ +249.36
Maximum Drawdown$ -144.40
Total Portfolio P&L$ +136.13
Disclaimer & Risk Disclosure
Disclaimer: The performance data and charts displayed in this section were recorded on September 23, 2026, using a live market replay system. The data covers the trading period from July 31, 2026, to September 23, 2026, tracking execution from one signal generation to the next. Please note that these are simulated historical results. Actual live trading results may vary slightly due to the inherent limitations of replay mode, such as the specific selection of date/time, bar formation delays, and real-world execution slippage.